
Overcoming Digital Divides
Making complex barriers visible.
- Partners
- Ryerson Leadership Lab, Brookfield Institute and TELUS; City of Toronto
- Role
- Led the full visual direction
- Scope
- Identity, custom illustration, layouts, digital assets, official reports
- Design outcome
- One illustrated system that made policy-heavy research feel welcoming, from workshops to reports
Overview
Overcoming Digital Divides was a six-part national workshop series on the systemic barriers to digital access in Canada, co-presented by the Ryerson Leadership Lab, the Brookfield Institute, the First Nations Technology Council and SFU Public Square, with TELUS as title sponsor. The content was policy-heavy, so the design needed to make it welcoming without making it simple.
Illustration as an access point
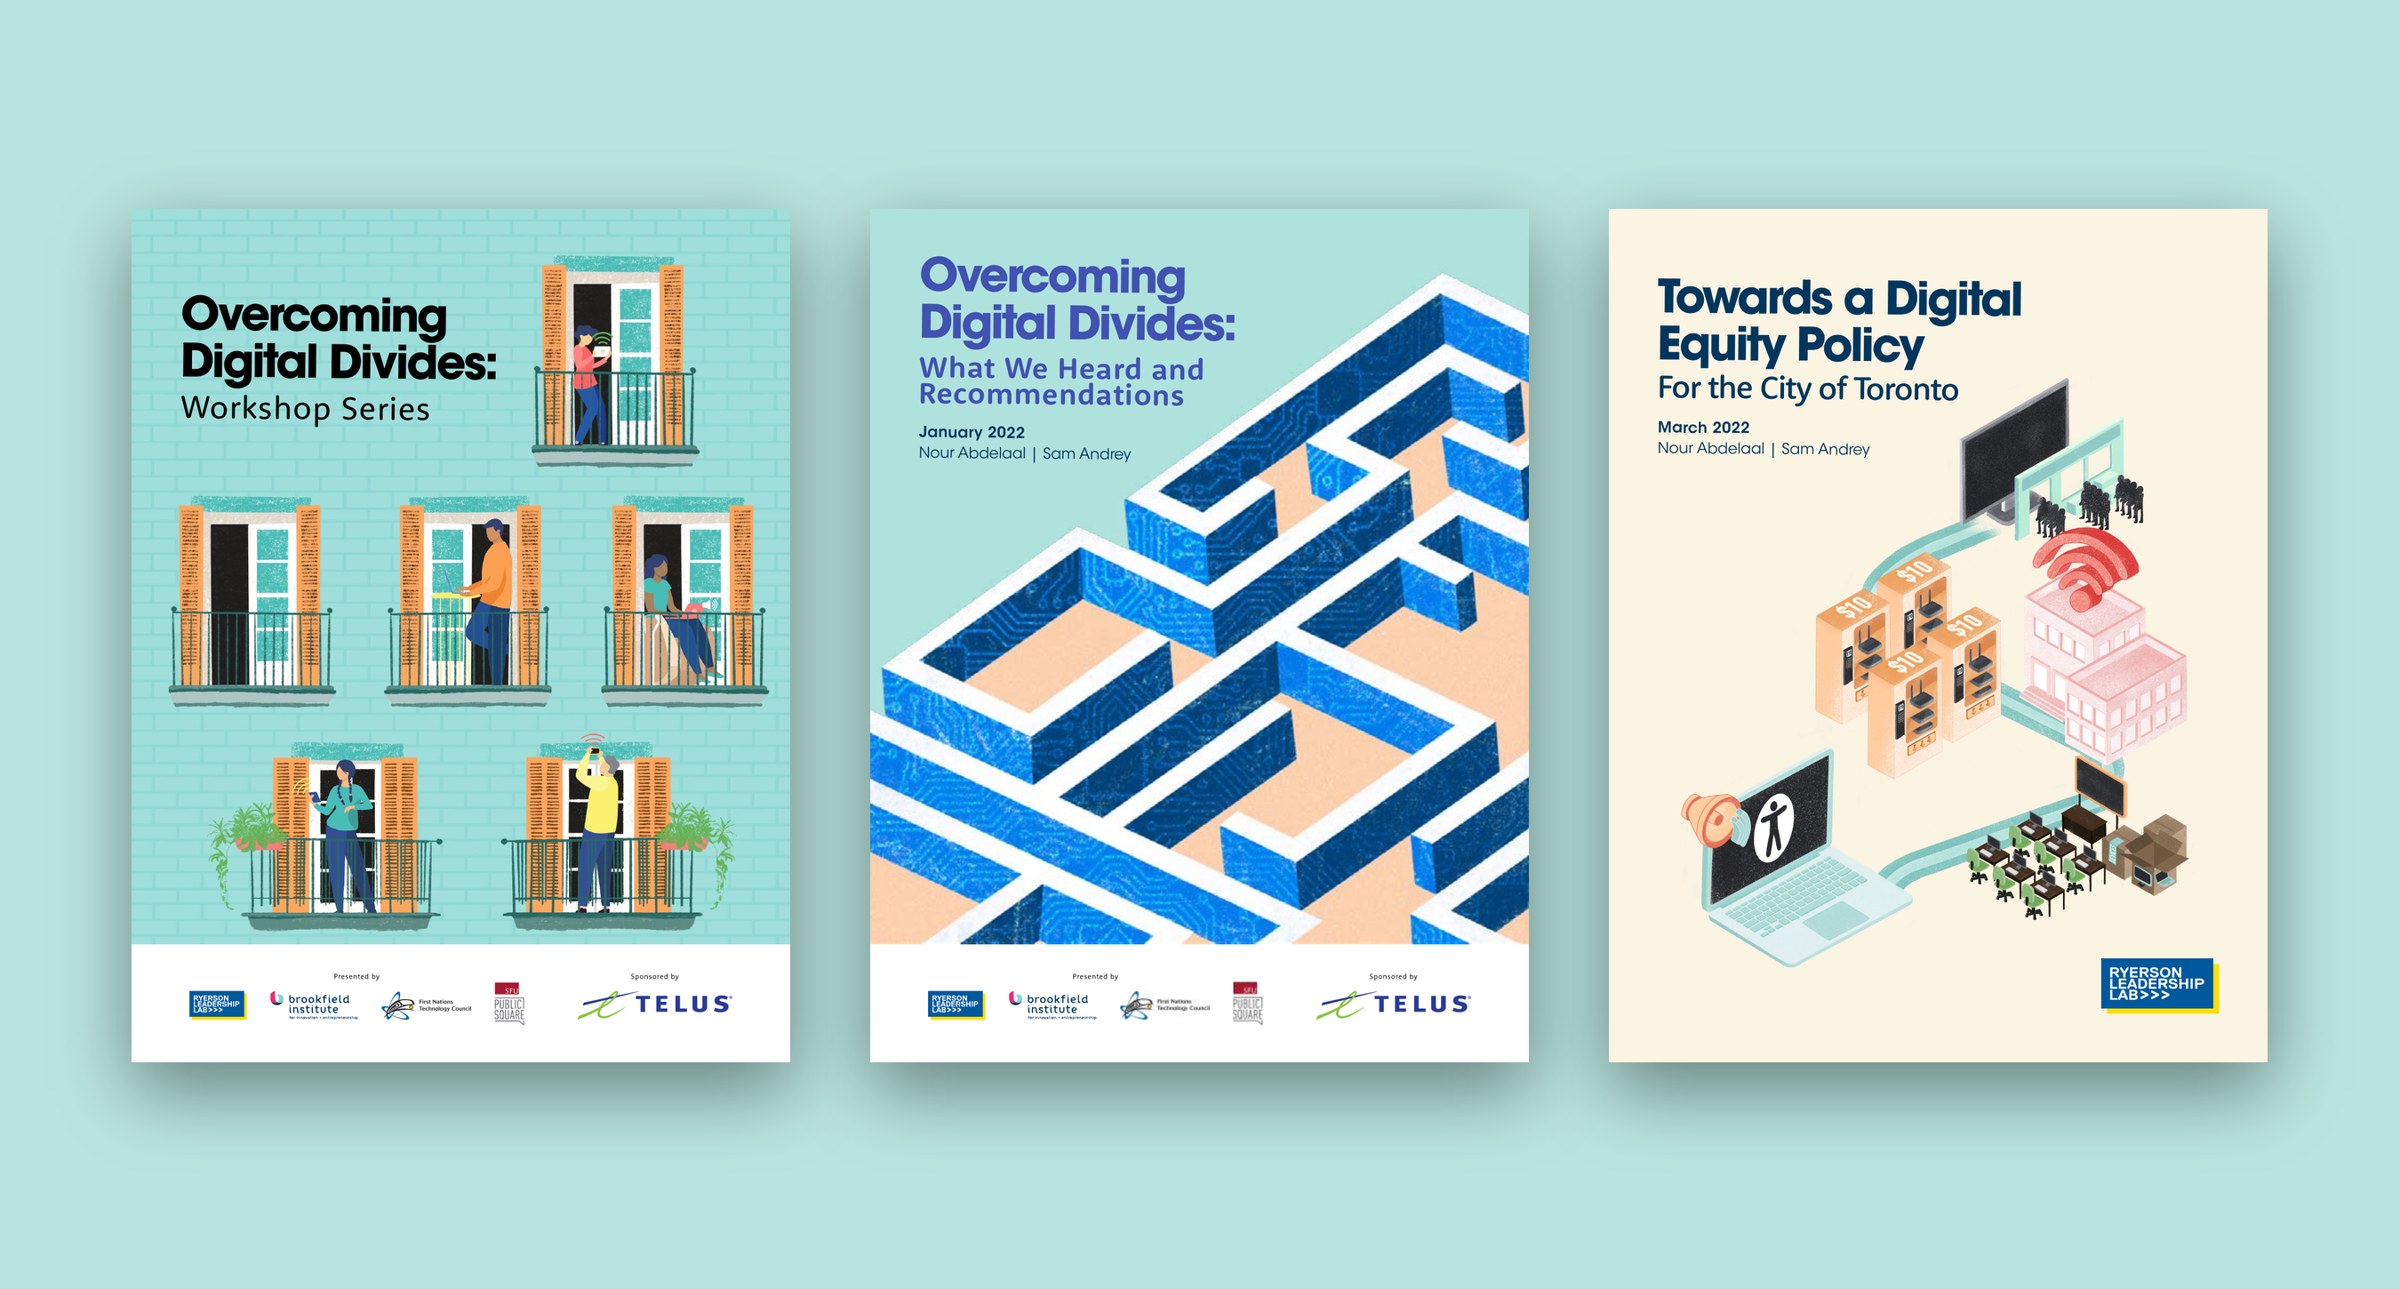
I created a cohesive visual identity with custom illustrations, layouts and digital assets. Each illustration focuses on one community or barrier, such as rural and remote communities, low-income households, people with disabilities, youth and older adults, within a shared colour and illustration language, so together they read as a connected series.






One identity, many partners
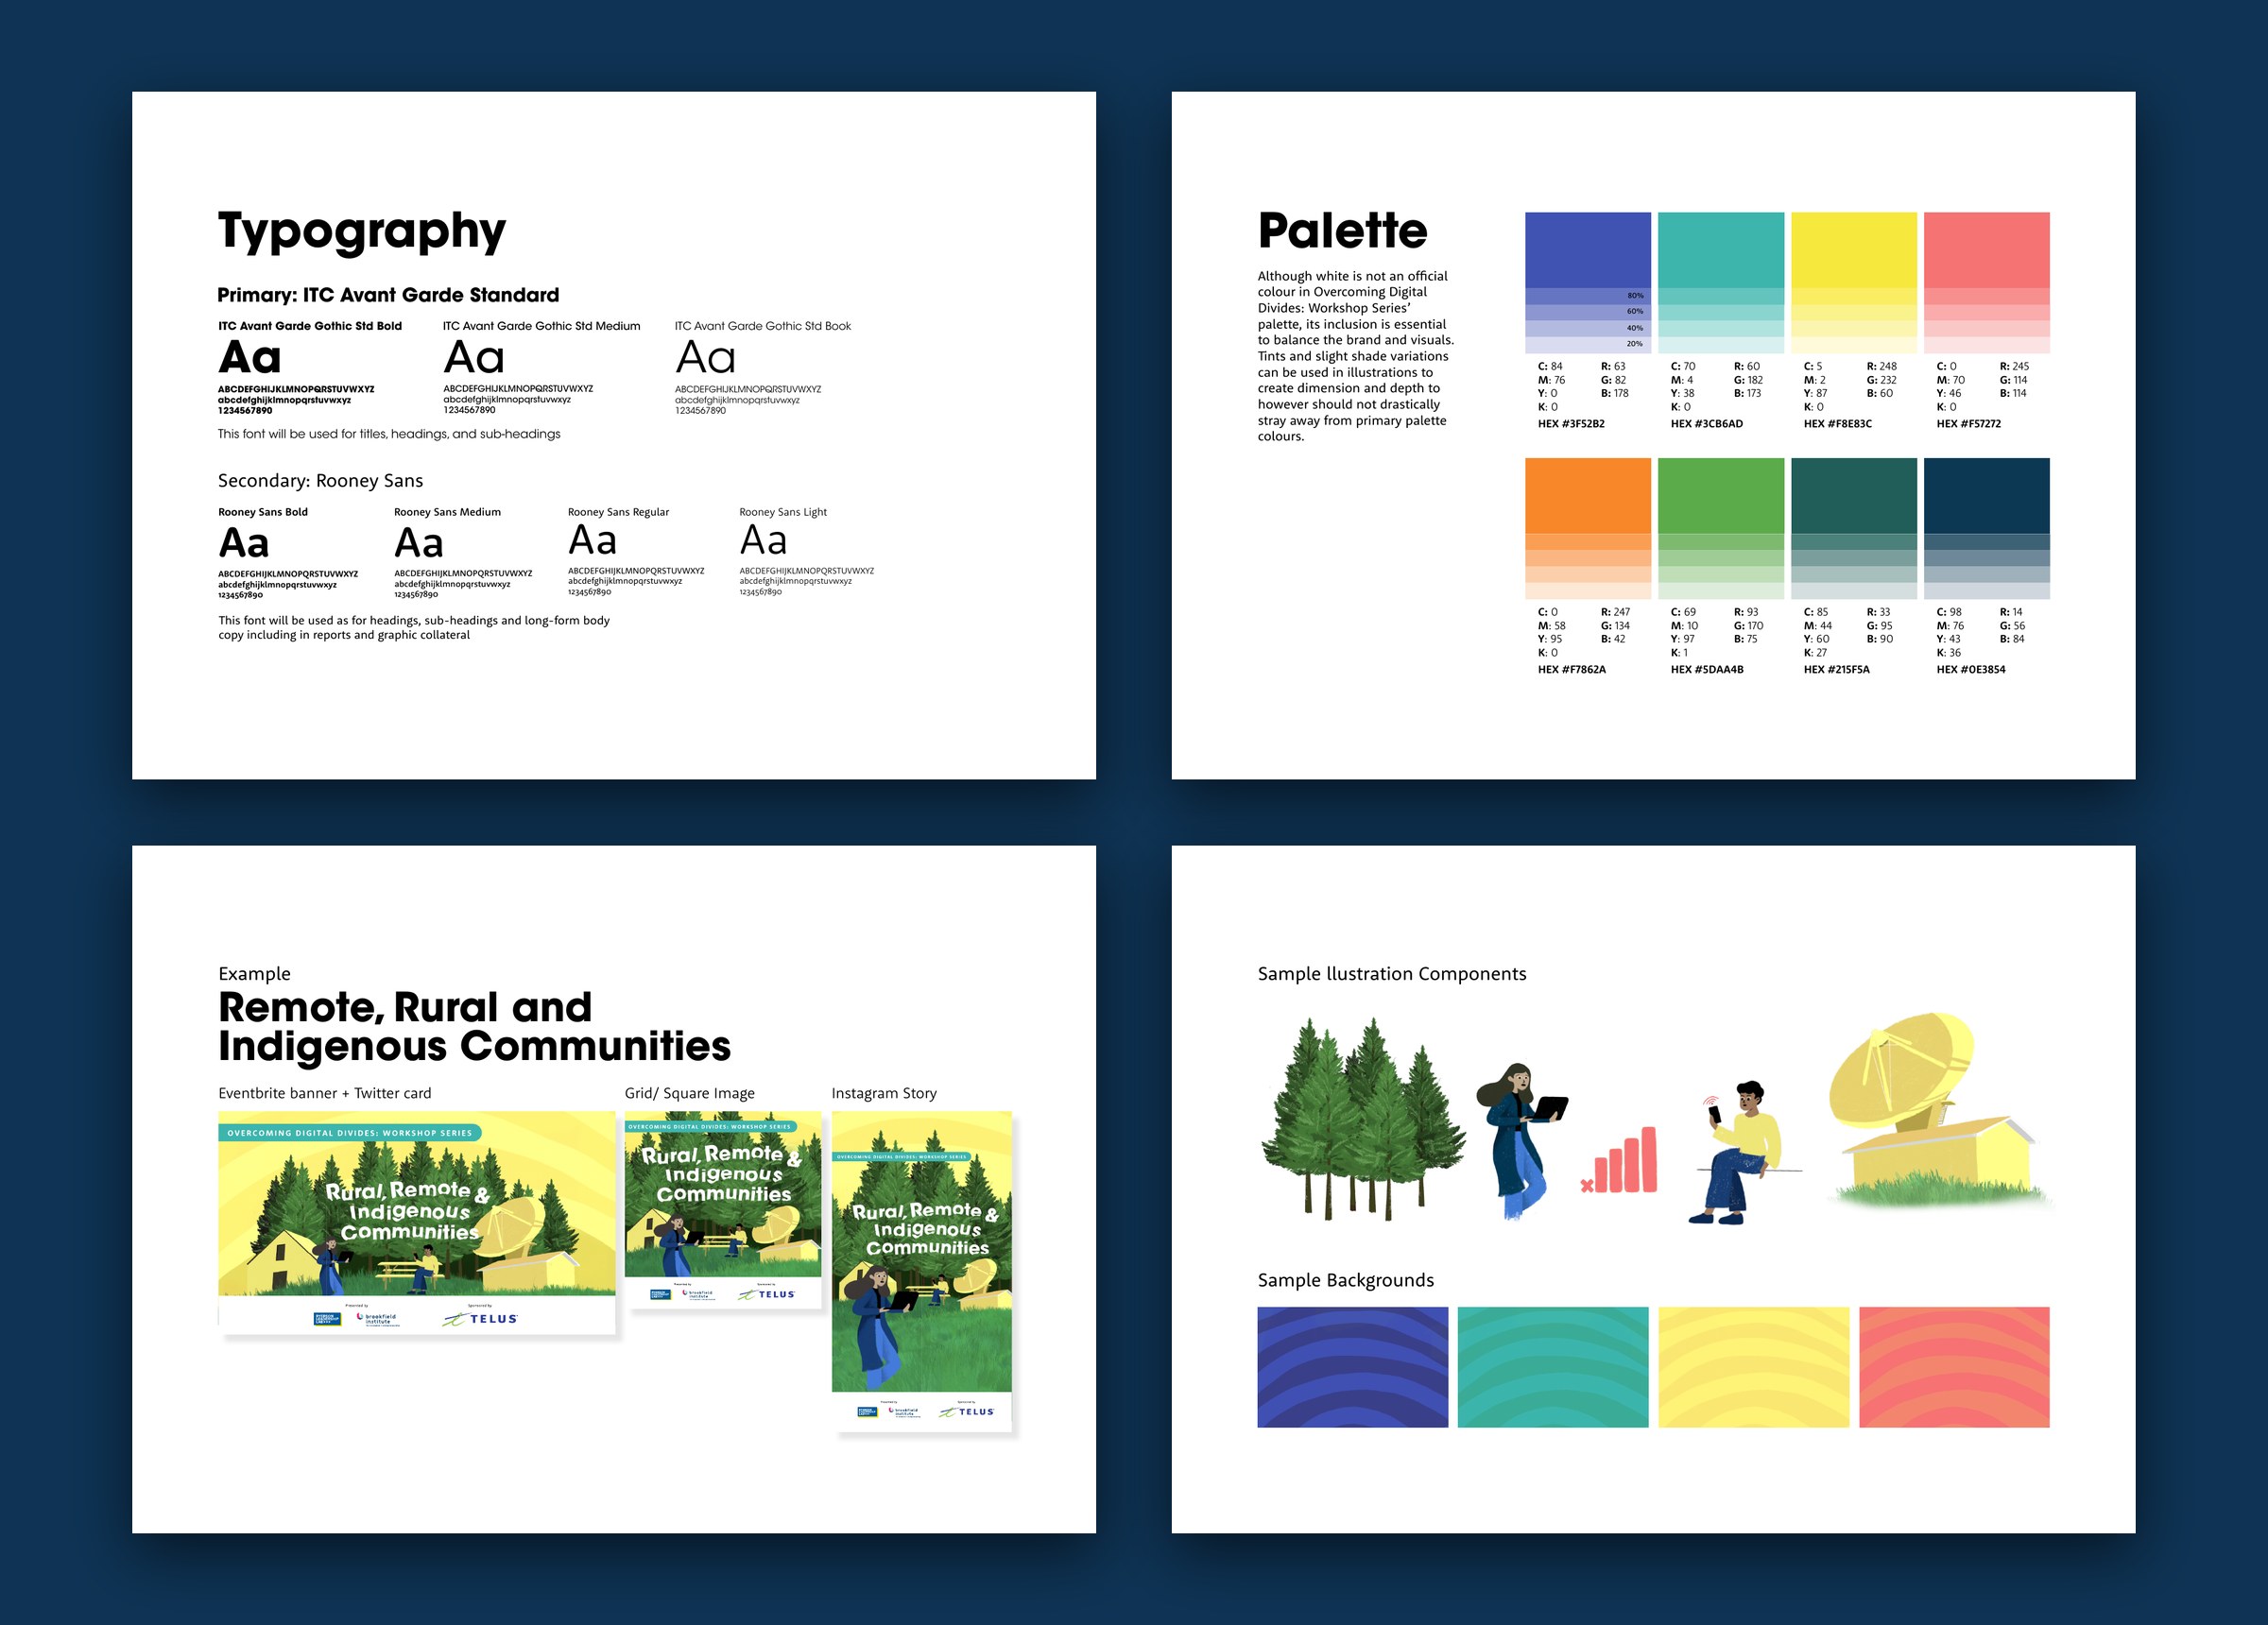
With several presenting partners and a title sponsor, the identity had to sit comfortably beside a row of logos. I built it on ITC Avant Garde and Rooney Sans, an eight-colour palette with tints for depth, and clear illustration rules: people reflect a range of ethnicities, genders, body types and incomes, with no stereotypes. Each illustration then flexed into event banners, square posts and stories.
From campaign to research reports
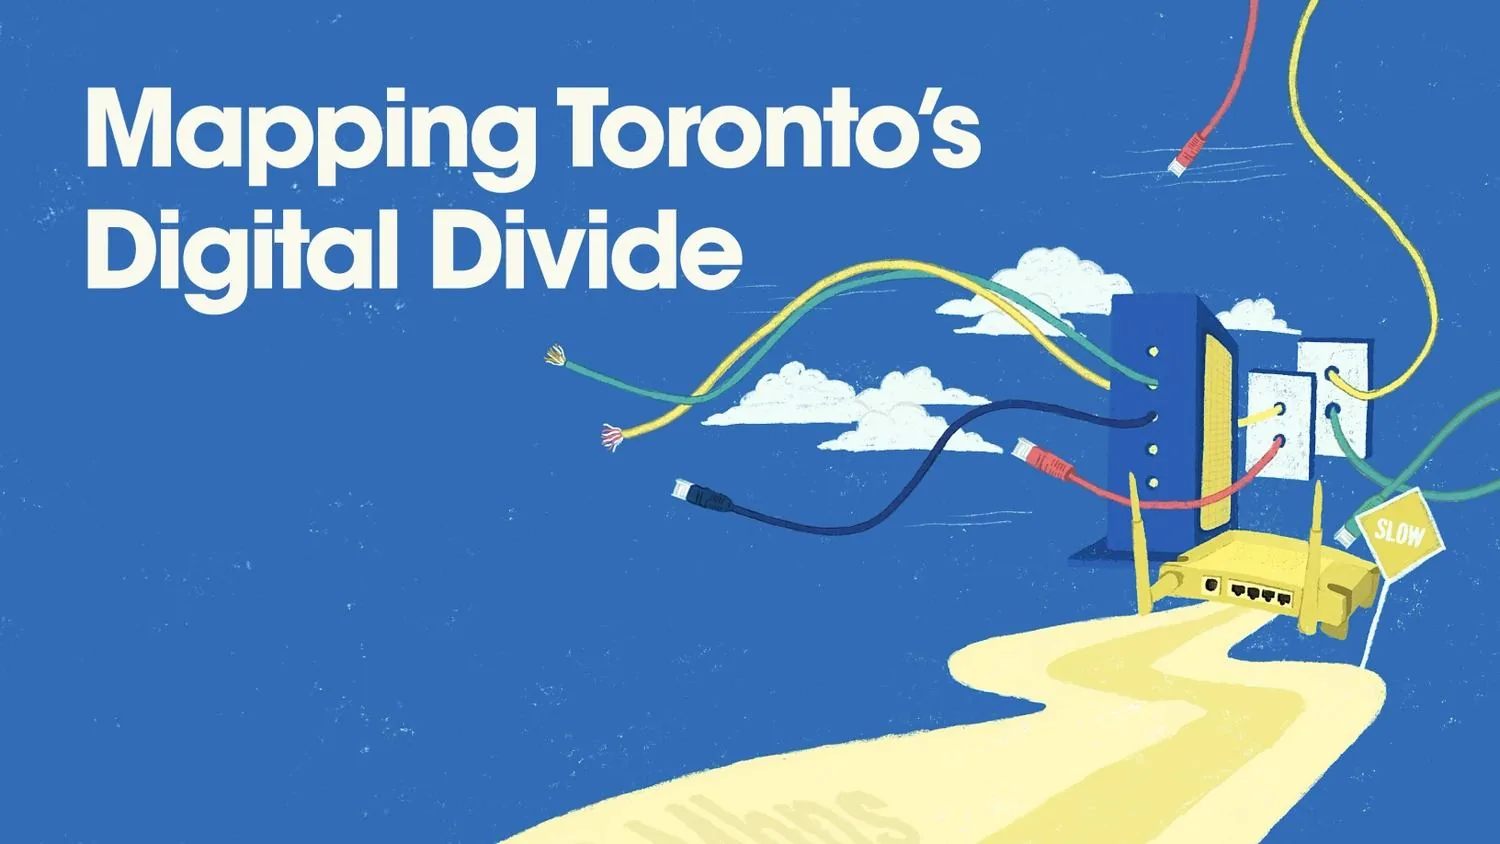
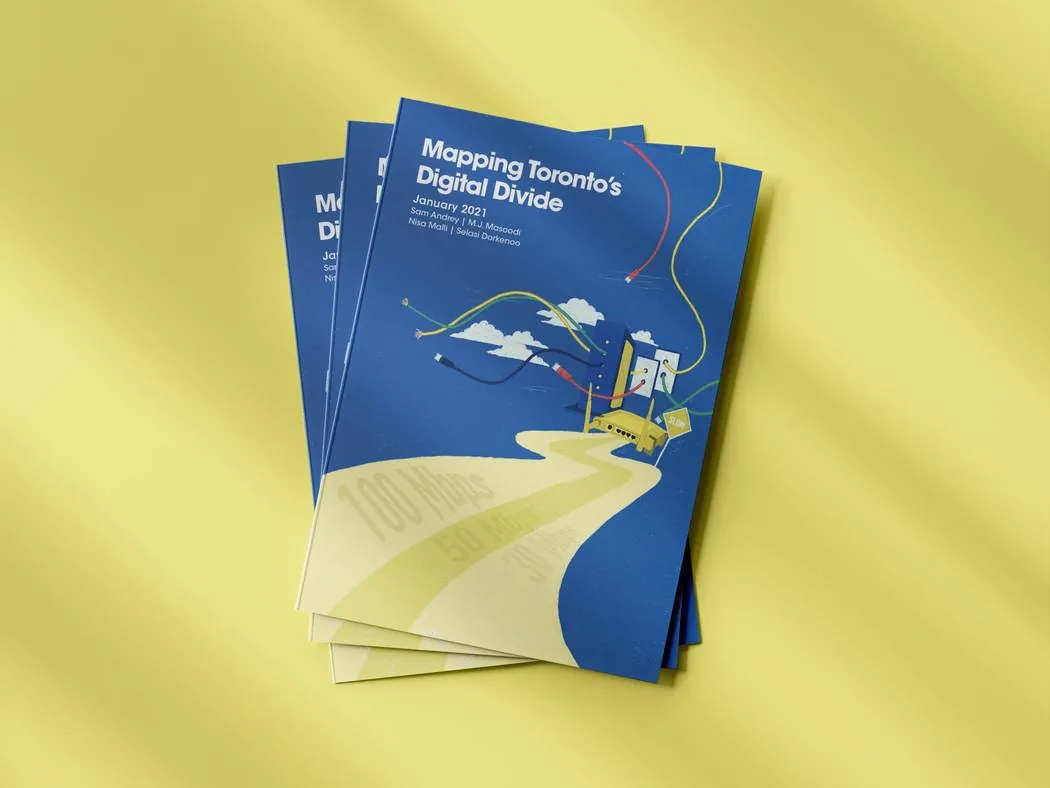
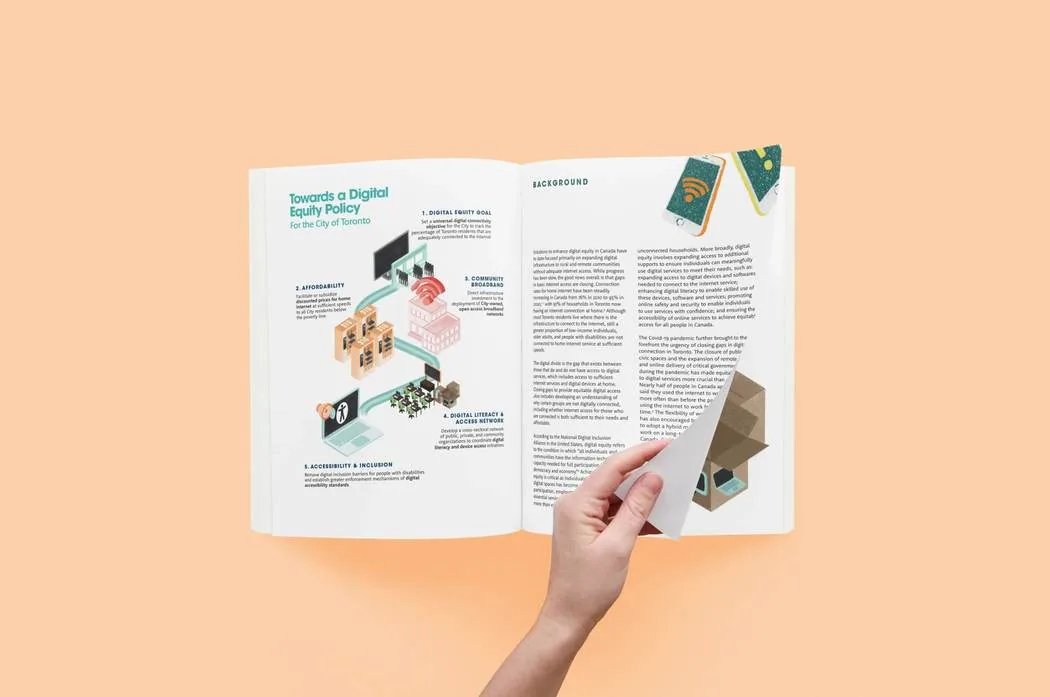
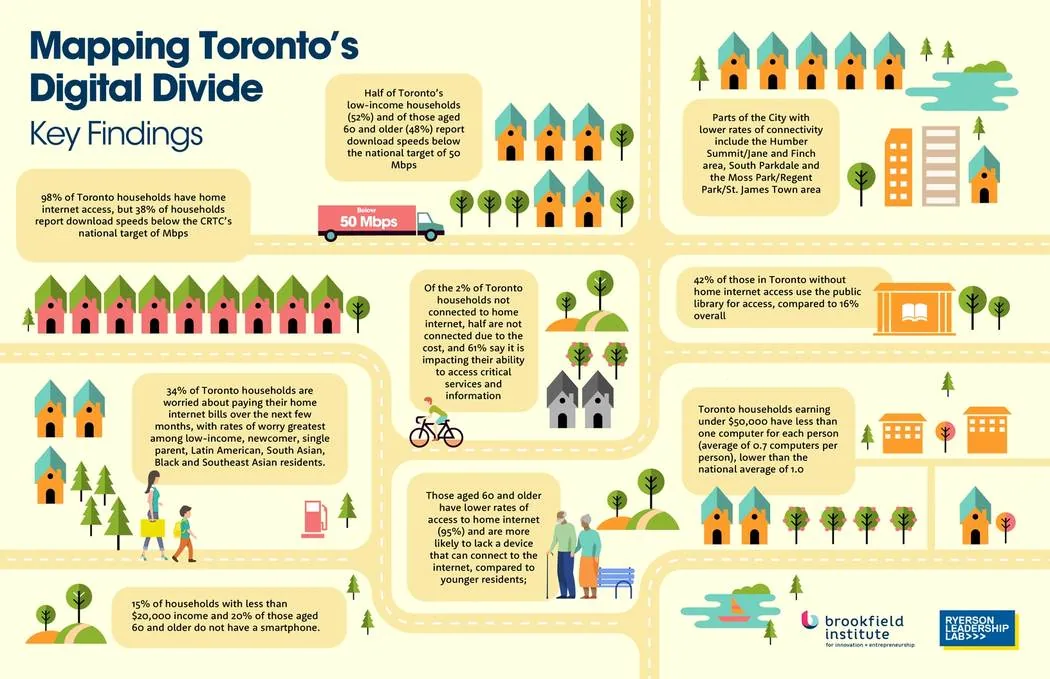
The same illustrations and palette carried into the reports that followed, including What We Heard and Recommendations and Towards a Digital Equity Policy for the City of Toronto, which I designed as Design Lead at the Ryerson Leadership Lab. That work laid the foundation for Mapping Toronto’s Digital Divide, a multi-year research initiative supported by the City of Toronto, where I designed the official reports and turned survey findings and multi-source data into visual narratives.
Policy you can see at a glance
Ideas like affordability or a policy goal are hard to chart. For Towards a Digital Equity Policy, I turned each of the five recommendations into an object people recognize and joined them with one path, so readers could see the whole plan before reading the detail.
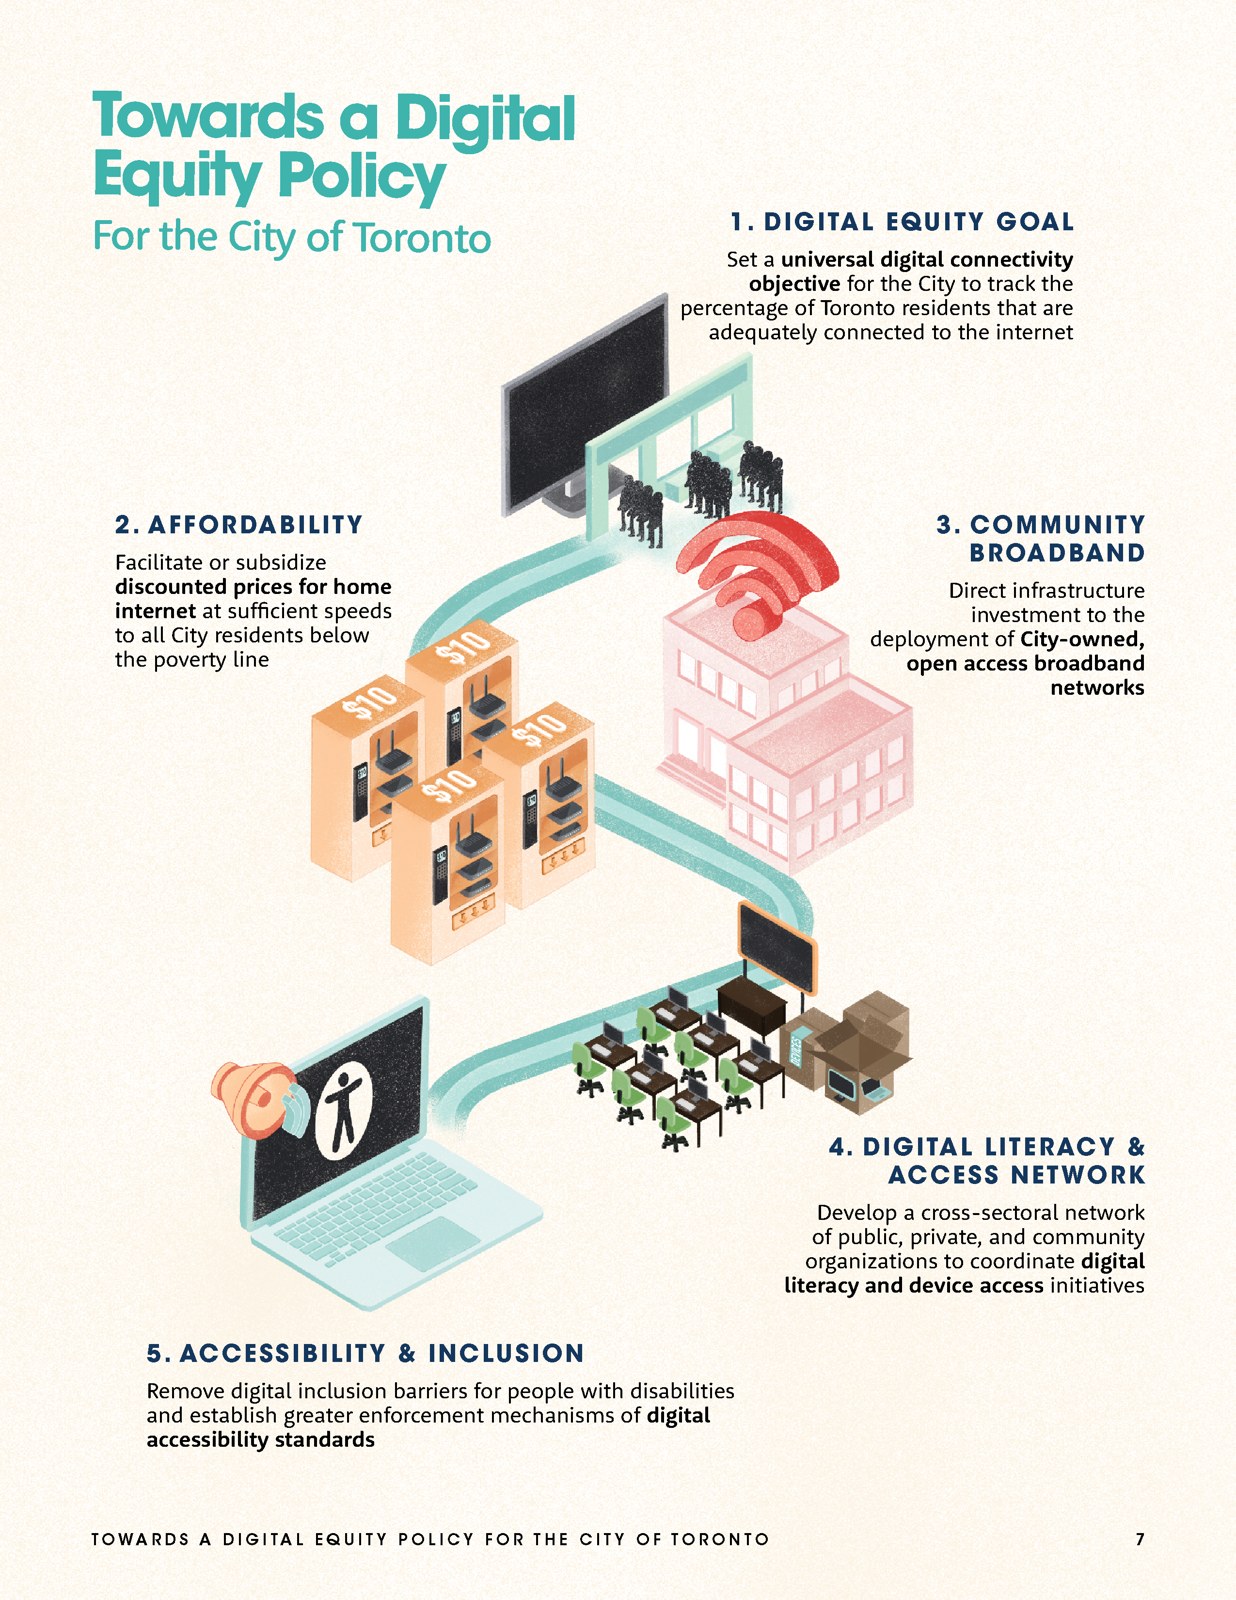
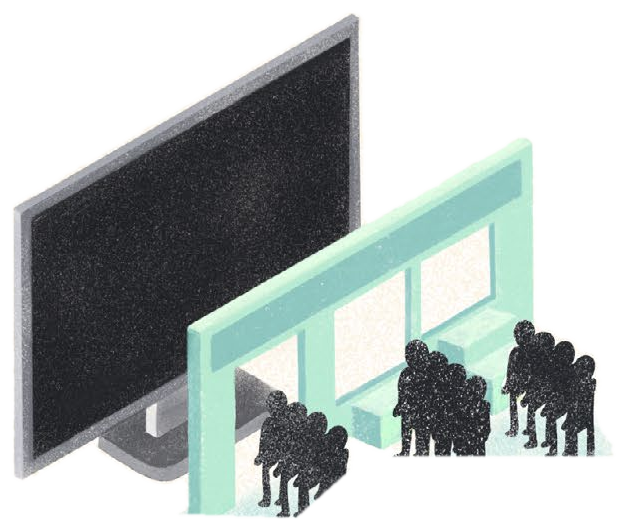 01Digital equity goal
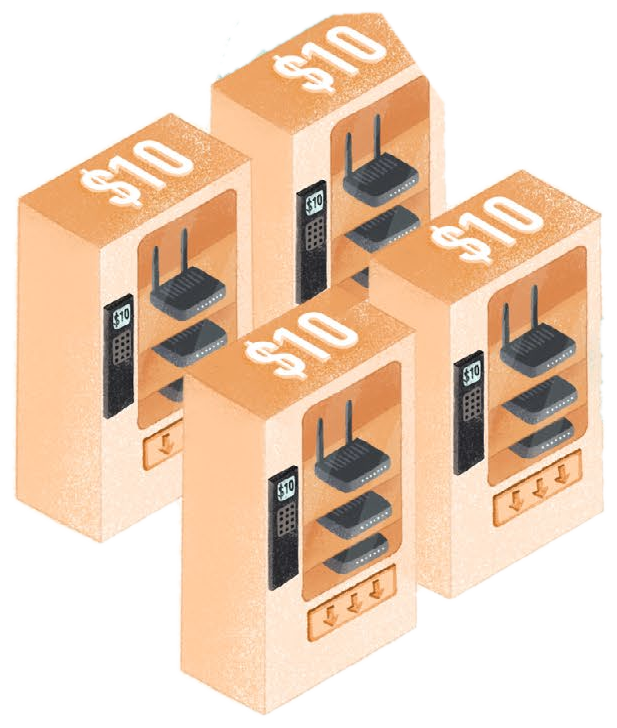 02Affordability
 03Community broadband
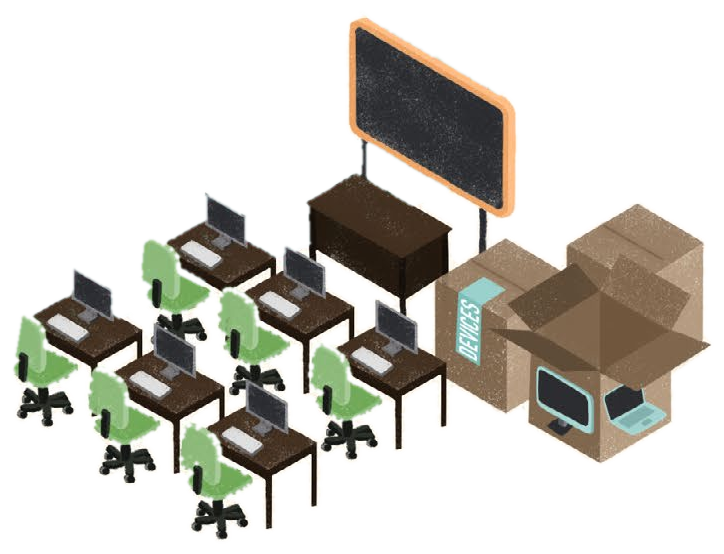 04Digital literacy
 05Accessibility
What the work supported
These are campaign results that the design supported.